Introduction
Sailfish vs BenchmarkDotNet
Sailfish and BenchmarkDotNet are both excellent benchmarking libraries — but they are built to answer different questions. Rather than tell you which one is "better", this page shows you real measurements: we ran the same three workloads through both tools, collected 10,000 raw samples per series, and plotted the distributions side by side.
The short version:
- BenchmarkDotNet answers: "What does this operation cost, amortized over a saturated hot loop?" — the right question for nanosecond-scale code that genuinely runs millions of times back-to-back.
- Sailfish answers: "What does one call cost — and what does the distribution of call costs look like?" — the right question for database queries, API handlers, and anything request-scoped, where the p95/p99 tail is the user experience.
Measured like-for-like, the two engines agree (see the CpuHash plot below). What differs is methodology, output, and workflow.
What we learned
Four findings, each backed by a plot below:
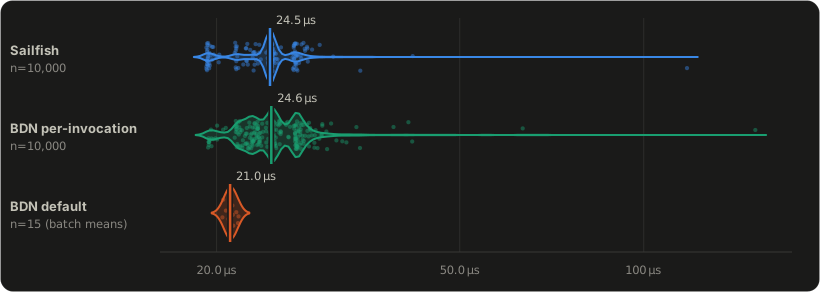
- Measured like-for-like, the two engines agree. With both tools timing one invocation per sample at n = 10,000, the CPU-bound workload's medians land 0.5% apart (Sailfish 24.46 µs, BDN 24.58 µs), each with a ±0.17% confidence interval. Sailfish's measurement engine is as trustworthy as BenchmarkDotNet's — the tools differ in methodology and workflow, not accuracy.
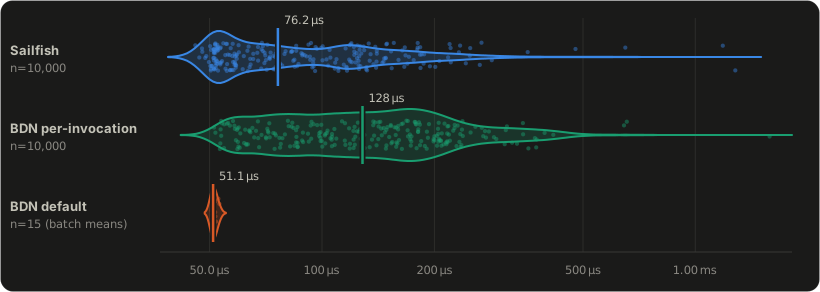
- For EF Core / SQL queries, the tools answer different questions. BDN's default batching reports a hot-loop figure of 51 µs; per-call reality is a distribution — median 76 µs, p95 219 µs, p99 326 µs. Only per-invocation measurement shows the tail you'd quote in an SLA conversation, and that is Sailfish's native mode.
- The same statistics cost Sailfish a fraction of the time. Collecting these 30,000 samples: Sailfish 34 s, BenchmarkDotNet 126 s (3.7×). At out-of-the-box defaults the gap was 3.8 s vs 71 s (~18×). Scaling n from 100 to 10,000 tightened median confidence intervals from ~5% to 0.2–3%.
- Sample size changes the answer for stateful code. The EF query keeps getting faster for thousands of invocations as caches warm (BDN per-invocation drifted from ~266 µs early in its run to ~115 µs late; Sailfish 133 → 96 µs). That's a property of the workload, not either tool — see Sample size changes the answer below.
The experiment
Three workloads, chosen to span the measurement scale, were implemented once as static methods in a shared assembly. Both tools invoked the exact same code — only the measurement harness differed:
| Workload | What it is | True scale |
|---|---|---|
EfCoreQuery | EF Core LINQ query (filter + order + take 20) against seeded in-memory SQLite, 5,000 rows | ~0.1 ms |
CpuHash | SHA-256 over a fixed 64 KB buffer | ~20 µs |
TinyOp | Sum of a 256-element int array | ~70 ns |
Each chart shows three series:
- Sailfish —
SampleSize = 10000, defaults otherwise. One measurement per invocation. - BDN per-invocation — BenchmarkDotNet configured to Sailfish's geometry (
InvocationCount = 1, UnrollFactor = 1, IterationCount = 10000), as the like-for-like bridge between the tools. - BDN default — stock BenchmarkDotNet. Its pilot stage sizes an invocation batch (thousands of calls per iteration) and each recorded measurement is the mean of that batch — which is why its violins are narrow needles.
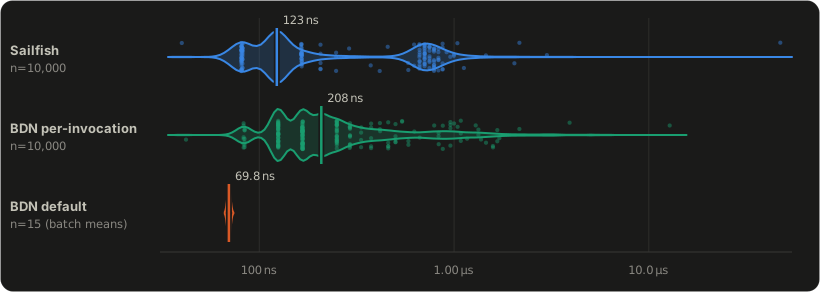
Violins are kernel-density shapes of the raw measurements on a log-scale axis; dots are a subsample of the actual measurements, and the vertical tick marks the median. Violin width is normalized per row — it shows where samples concentrate, not sample count.
Environment: macOS / Apple Silicon (Arm64), .NET 9.0.9, BenchmarkDotNet 0.15.4, single machine, one run per configuration.
EF Core query — the request-scoped case
Interpretation
The two per-invocation distributions (blue, green) show what single query calls actually cost: median 76 µs, p95 219 µs, p99 326 µs (Sailfish). The orange needle is BDN default's answer — 51 µs — a hot-loop mean in which thousands of back-to-back queries keep EF's query cache, SQLite's page cache and the allocator perfectly warm, and GC pauses are averaged away. Neither number is wrong; they answer different questions. But the tail — the part you'd quote in an SLA conversation — only exists in the per-invocation view, and BDN default's p99 sits just 4% above its median because batching erased it. The gap between the blue and green medians (76 vs 128 µs) is warm-up policy, not engine accuracy: this workload keeps getting faster for thousands of calls as caches warm, and BDN's run spent longer cold.
To be plain: stock BenchmarkDotNet never measures your query once
Point an out-of-the-box BenchmarkDotNet benchmark at this query and it does not time individual runs. Its pilot stage decides the query is too fast to time alone and sizes a batch — 4,096 invocations per measurement in this experiment. Each recorded "measurement" is: start the clock, run the query 4,096 times back-to-back, stop the clock, divide by 4,096. The individual call times are never observed, so no p95/p99 of real query calls can ever be computed from a stock BDN run — the tail isn't hidden in the data, it was never collected. Getting per-call measurements out of BDN requires knowing to configure WithInvocationCount(1).WithUnrollFactor(1), at which point BDN warns that iteration times under 100 ms "may affect accuracy", trims outliers by default, and still reports mean ± error unless you opt into percentile columns. Per-call measurement is Sailfish's default behavior; in BDN it is an off-label configuration you must know to ask for.
SHA-256 hashing — the engine parity result
Interpretation
This is the accuracy verdict. On a stationary workload with no cache or GC drama, the Sailfish and BDN per-invocation violins are nearly identical: medians of 24.46 µs vs 24.58 µs — 0.5% apart, each with a ±0.17% confidence interval at n = 10,000 — and p95s within 5% of each other. Whatever the two measurement engines do differently under the hood, it does not show up in the data: Sailfish measures as accurately as BenchmarkDotNet when both time the same thing. BDN default's batch mean (21.0 µs) sits ~15% lower because batching amortizes per-call costs (cache effects, allocator, occasional GC) that per-invocation measurement correctly attributes to individual calls.
Tiny operation — BenchmarkDotNet's home turf
Interpretation
Below a microsecond, batching wins. BDN default's batched measurement pins the true cost at ~70 ns with a CV of 0.6% — the orange needle. Timing single invocations of a nanosecond-scale op is inherently noisy: Sailfish's median lands at 123 ns (within ~2× of truth once the JIT has fully tiered up — the multiple lobes in the violins are JIT tiers) and BDN forced into the same per-invocation mode reads 208 ns, with both showing enormous dispersion (CV ~150–200%). Two takeaways: the single-shot noise floor is a physics problem, not a Sailfish defect — BDN fares no better in the same mode — and if you are micro-optimizing sub-microsecond code, use BenchmarkDotNet's default batching (or Sailfish's OperationsPerInvoke to batch manually).
Summary statistics
All values are per-call times from the 10,000-sample run (BDN default: 15 batch means).
| Workload · series | median | p95 | p99 | p99.9 | CV |
|---|---|---|---|---|---|
| EfCoreQuery · Sailfish | 76.2 µs | 219 µs | 326 µs | 762 µs | 70% |
| EfCoreQuery · BDN per-invocation | 128 µs | 331 µs | 434 µs | 655 µs | 59% |
| EfCoreQuery · BDN default | 51.1 µs | 52.9 µs | 53.1 µs | 53.1 µs | 1.5% |
| CpuHash · Sailfish | 24.5 µs | 27.6 µs | 32.1 µs | 61.5 µs | 13% |
| CpuHash · BDN per-invocation | 24.6 µs | 28.9 µs | 39.5 µs | 72.8 µs | 18% |
| CpuHash · BDN default | 21.0 µs | 21.7 µs | 21.7 µs | 21.7 µs | 1.8% |
| TinyOp · Sailfish | 123 ns | 873 ns | 1.33 µs | 3.75 µs | 196% |
| TinyOp · BDN per-invocation | 208 ns | 1.13 µs | 2.75 µs | 5.54 µs | 152% |
| TinyOp · BDN default | 70 ns | 70 ns | 71 ns | 71 ns | 0.6% |
Collecting the 30,000 per-invocation samples took Sailfish 34 s and BenchmarkDotNet 126 s (BDN runs each benchmark in a child process and requires a Release build; Sailfish runs in-process). At out-of-the-box defaults the gap was 3.8 s vs 71 s.
So which one should I use?
| Your benchmark | Reach for |
|---|---|
| SQL / EF Core queries, HTTP handlers, request-scoped code | Sailfish — per-call latency distributions with real p95/p99 tails are its native output |
| Service-level code in the µs–ms range | Sailfish — same accuracy, faster suites, test-project workflow, SailDiff regression verdicts |
| Sub-microsecond hot-path code, allocation hunting, disassembly | BenchmarkDotNet — batched invocation is the only low-variance way to resolve nanoseconds |
Two further considerations from this experiment:
- The speed advantage compounds in automated loops. 30,000 samples in 34 s vs 126 s means roughly 4× more hypotheses tested per unit time when a person — or an AI agent — is iterating on a query. Sailfish also runs in-process and hands back raw samples as objects through its API (this harness consumed
RawExecutionResultsdirectly), where BenchmarkDotNet requires child processes, a Release build, and parsing multi-megabyte artifact files. For tool-in-the-loop workflows, that is a materially simpler contract. - Within one suite, hold tool and warm-up policy constant. On stationary workloads the tools agree; on warming workloads (EF), warm-up policy dominates the absolute number. Track deltas within one tool and one configuration rather than comparing absolutes across tools.
Sample size changes the answer
Scaling this experiment from 100 to 10,000 samples did two very different things at once, and separating them matters:
It tightened the statistics. Median 95% confidence intervals went from ~5% wide at n = 100 to 0.2% (CpuHash) and ~3% (EfCoreQuery — wide only because of drift). p99 and p99.9 became estimable. This is the ordinary √n payoff, and it is what made the engine-parity result visible.
It changed what was being measured. More invocations = a hotter process:
| Series | median at n = 100 | median at n = 10,000 |
|---|---|---|
| EfCoreQuery · Sailfish | 199.6 µs | 76.2 µs |
| EfCoreQuery · BDN per-invocation | 162.4 µs | 128.4 µs |
| TinyOp · Sailfish | 1.37 µs | 123 ns |
| CpuHash · Sailfish | 21.8 µs | 24.5 µs |
| CpuHash · BDN per-invocation | 24.1 µs | 24.6 µs |
The EF query keeps warming for thousands of calls (caches, allocator), and the tiny op needs thousands of invocations before the JIT fully tiers up. CpuHash — stationary — barely moved, and both tools shifted together (a run-to-run environment change that hit both equally).
Decide your regime, then hold it constant
Whichever tool you use, decide which regime you are measuring — "first calls after startup" or "steady state under traffic" — and hold your warm-up policy and sample size constant between runs. In Sailfish that policy is explicit: NumWarmupIterations and steady-state warmup.
Reproducing this experiment
The full harness — shared workloads, both runners, the merge and plot scripts, and the raw samples behind these charts — lives in the repository at benchmarks/sailfish-vs-benchmarkdotnet. To re-run it:
cd benchmarks/sailfish-vs-benchmarkdotnetdotnet run --project SailfishRun -c Release -- ./compare-outputdotnet run --project BdnRun -c Release -- ./compare-outputpython3 analysis/merge_csvs.py ./compare-outputpython3 analysis/make_svgs.py ./compare-output/samples.jsonThe last step regenerates the SVG plots on this page from your machine's data. (The two runners are separate processes by necessity: BenchmarkDotNet pins Perfolizer 0.5.3 exactly while Sailfish requires ≥ 0.7.1, so the two tools cannot be referenced from one project.)
Caveats
- Single machine (Apple Silicon macOS), one run per configuration. Absolute numbers will differ on your hardware; the structural findings (batch means vs per-call distributions, the single-shot noise floor, engine parity) will not.
- SQLite in-memory understates the case for per-call measurement: against a real networked database, per-call latency dominates even more, and a hot-loop mean becomes even less representative of production behavior.
- BDN default's narrow violins summarize 15 batch means — their tightness is a property of averaging, not proof the workload is stable.
- Sailfish values shown are raw (
RawExecutionResults), before Sailfish's own outlier handling.